Statistics
This document is a sort of engineer's genealogical analysis. The keystone of this
work is creating videos of migration paths. I'll get to that last. There are a few
analyses I've come up with, regarding my family tree. The primary data is names,
places, and dates. Other info might be mined for more. But here are a few I've
determined.
First names:
From my verifiable tree, through my 6th-great grandparents, I've compiled all the
first names. There were 86 distinct male names, 40 of which were unique, and 9
different that start with J. The most common by far was John (not even counting the
German ones which almost all referred to their patron saint John). The second most
common was William, which was three times as much as the third most common. There
were 61 different female names, and 37 were unique. Mary was most common and
Elizabeth second, again three times as much as the third most common.
DNA versus country of origin:
A person has 128 5th-great-grandparents. I've compiled where genealogy says these
came from for my parents.
My father's origins:
48% from England
20% from Scotland
8% from Ireland (not counting Scots-Irish)
7% from Wales
5% from Germany
5% from France
4% from Switzerland
2% from Holland
1% from Africa
He had his DNA tested, and the current "ethicity estimate" says:
47% English
30% Scottish
12% Irish
5% Scandinavian
4% German
1% Nigerian
My mother's origins:
62% from England
14% from Scotland
8% from Wales
6% from Germany
3% from France
3% from Ireland
2% Native American
1% from Holland
1% from Sweden
Her ethnicity estimate says:
64% English
18% Scottish
8% Scandinavian
6% German
4% Irish
The first thing to note from these results is the English DNA is remarkably
well-matched to the percentage of my ancestors that immigrated from England. I
think this is probably a coincidence really, because I don't know how they could
completely differentiate English DNA from that of mainland Europe. Vikings probably
were predominantly of the same male chromosomes, but Germans and French and English
and Scottish are a mix of Celtic and Germanic. Anyway, I believe my father had two
Nigerian ancestors out of 128, which makes about 1.5%, and correlates with the DNA.
Scottish and Irish are higher in DNA than in culture. There's no DNA category for
French or Welsh, so I'm not sure what other bucket they're going into. I would think
that Welsh is like either Irish or English, and my French ancestors were very similar
to my German ones. Scandinavian must be coming from my Irish and Scottish ancestors,
though I'm not aware that I have any Irish ancestors of ultimately Scandinavian
origin. The last thing to note is that my mom is at least as much Native American as
my dad is Nigerian, yet it doesn't show up in the DNA. I'm certain that if my mom's
father had been tested, he would've registered at least 2% Native American. That
would've been a surprise, as we always believed the most likely source in our family
came from my mom's mom.
The primary analysis I've done is of residence, that is, our family legacy in all of
the country, going back to the immigration points. I've become familiar with our
deep history now, but before I got into genealogy, all I was aware of outside
Arkansas, Oklahoma, and Mississippi, was my dad saying the Scotts came from Tennessee.
As I filled out my family tree, I realized that most of my ancestors came through
Virginia. And they migrated through the Carolinas and the deep south as those
territories became available. (In some cases they went into places before settlement
there technically was approved). But putting it all in a chart really puts things
into perspective.
Before getting to the chart, here are the rules I followed in compiling the data.
One, I only counted residence on even decades, i.e. at the turn of one decade to
another. If a residence occurred within a decade, I haven't counted it. The residence
of a line terminates when the woman at the end of it wed into another line. So,
even if relatives continued to live in a place, I've only counted my direct ancestors.
My own direct family tree is enough to deal with than to try to follow all the branches.
If the immigrant was a woman, I didn't account for that line since she would've already
wed or soon would. I don't know who the immigrant was for some lines beyond my
6th-great grandparent, and in those cases I only count from the earliest known birth.
Because of these basic rules, the weight of legacy increases as you go back in time,
because the number of ancestors doubles with every generation back. So, keep all of
this in mind. I've only plotted our residence in eight states, although we have
history in 22 states. The lesser ones would only clutter up the bottom of the graph.
Just know that there's more, especially in Alabama, Kentucky, New Jersey, and
Massachusetts. We had six lines in Massachusetts, believe it or not. And of the
three states I mentioned originally being familiar with, only Arkansas registers
enough to make a plot that rises significantly above the X-axis. I also stopped the
chart at the year 1920, because modern mobility really scrambles the migration
pattern. This also suppresses the significance of recent residence in Arkansas and
neighboring states.
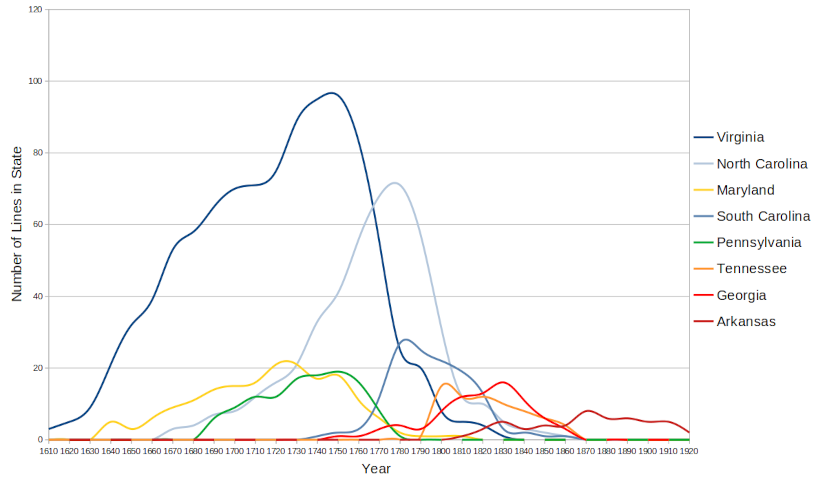
So, what we see above is plots of what lines were in what states over time. This puts
into proper perspective just how fundamental the state/colony of Virginia was to our
ancestors. They lived there for a mind-boggling total of 982 decades! That's almost
10,000 years! You can see that we had three lines in and around Jamestown by 1610,
three years after it was founded. But the majority left before the American Revolution,
and they were all gone by 1840. Most went to North Carolina, especially in the leadup
to the War. I've observed that there must've been a lot of population pressure built
up by about 1740. I wonder if that had more to do with a Revolution occuring than
oppressive taxation. The law of the 1763 line that attempted to prevent settling west
of the Appalachias had to be a real pain for our ancestors.
As can be seen, the next two most prominent colonies in our family history were Maryland
and Pennsylvania. They went to both as soon as they were formed, and all but the
McAtees had moved out by the Revolution. Tennessee opened up by 1800. Georgia was a
very early colony, and I believe technically the first to be ratified as a state, but
settlement there was suppressed until about the same time. All of our ancestors had
moved out of all of these states except Arkansas in the decade after the Civil War.
Here are some calculations I've made from this data, again following the stated rules:
The longest total span of years was 23 decades in Virginia
For perspective, the span in Arkansas has reached 20 decades up to the present.
The most lines in a state was Virginia, at 129
That's more than 50% of all my ancestors.
The longest residence in a state was our Pace line, at 190 years
This isn't counting the Tapps, who were in Virginia longer but we don't have records before 1610.
And lastly, which line has been in the country longest? As of today it's Hollis, which
came in 1635 and ended with my grandmother wedding into the McAtees in 1945. That's 310
years. Second longest at this moment is Hardcastle, having come in 1625 and ended with
my great-grandmother wedding into the Hollises in 1914. That's 299 years. Scott, which
has the advantage of being my line, and the only only one still going from my perspective,
immigrated in 1725. That's 297 years in 2022. We have to pass the year 2035 to
catch up with the Hollises.
Lastly in this document is my interest in making animated plots of migration on a map.
This is a large project that I still have a lot of work to do on. I've made one such
video of my great-great-grandparent lines, over a similar time span to the above chart.
I made a computer program to generate the frames of the video, but the process to compile
the data and then merge the frames into a video was a very labor-intensive process and
not automated. Consequently, I need to update the data in it, and I would have to repeat
the process. My intent is to create a new program that fully automates it all, so I can
make any variety of such videos and easily update them. Click on the image below to play
the video I've made. Note that I not only plot migration paths on a map, but the map
itself includes county boundaries that update over time. In this way you can see how
the country developed as our ancestors moved through it.
last edited 7 Dec 2022